Behind the Numbers: Solar Decathlon Scoring Explained
Wednesday, October 11, 2017
By Daniel Rubin and Alexis Powers
At the writing of this post, only two-tenths of a point separate first and second place in Solar Decathlon 2017. We are six days into the competition, and there are three days left.
What’s on the line?
Cash prizes up to $300,000 for the winner. And bragging rights of course (priceless).
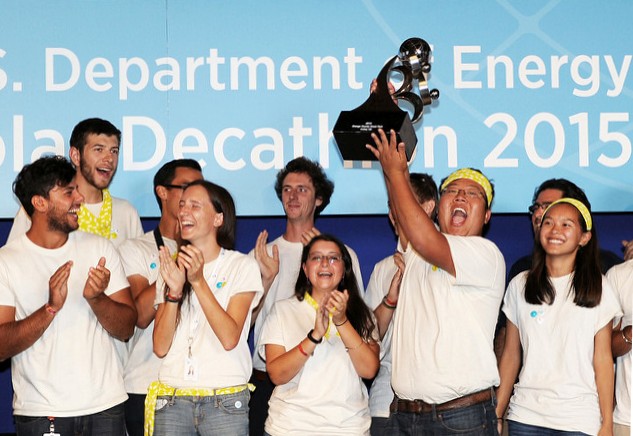 Stevens Institute of Technology celebrates its overall first-place victory at the U.S. Department of Energy Solar Decathlon 2015, October 17, 2015, at the Orange County Great Park, Irvine, California. (Credit: Thomas Kelsey/U.S. Department of Energy Solar Decathlon)
The Solar Decathlon, as you probably know, is made up of 10 contests. Each contest is worth 100 points, for a total possible score of 1,000. The 2017 competition consists of both juried (Architecture, Market Potential, Engineering, Communications, Innovation, and Water) as well as measured contests (Health and Comfort, Appliances, Home Life, and Energy).
So far, teams have been earning points in the measured contests, though the Energy points are not revealed until the end of the competition. To understand the current team standings, we interviewed Ed Hancock and Paul Norton—both veteran instrumentation team members—to get the story behind the current team scores.
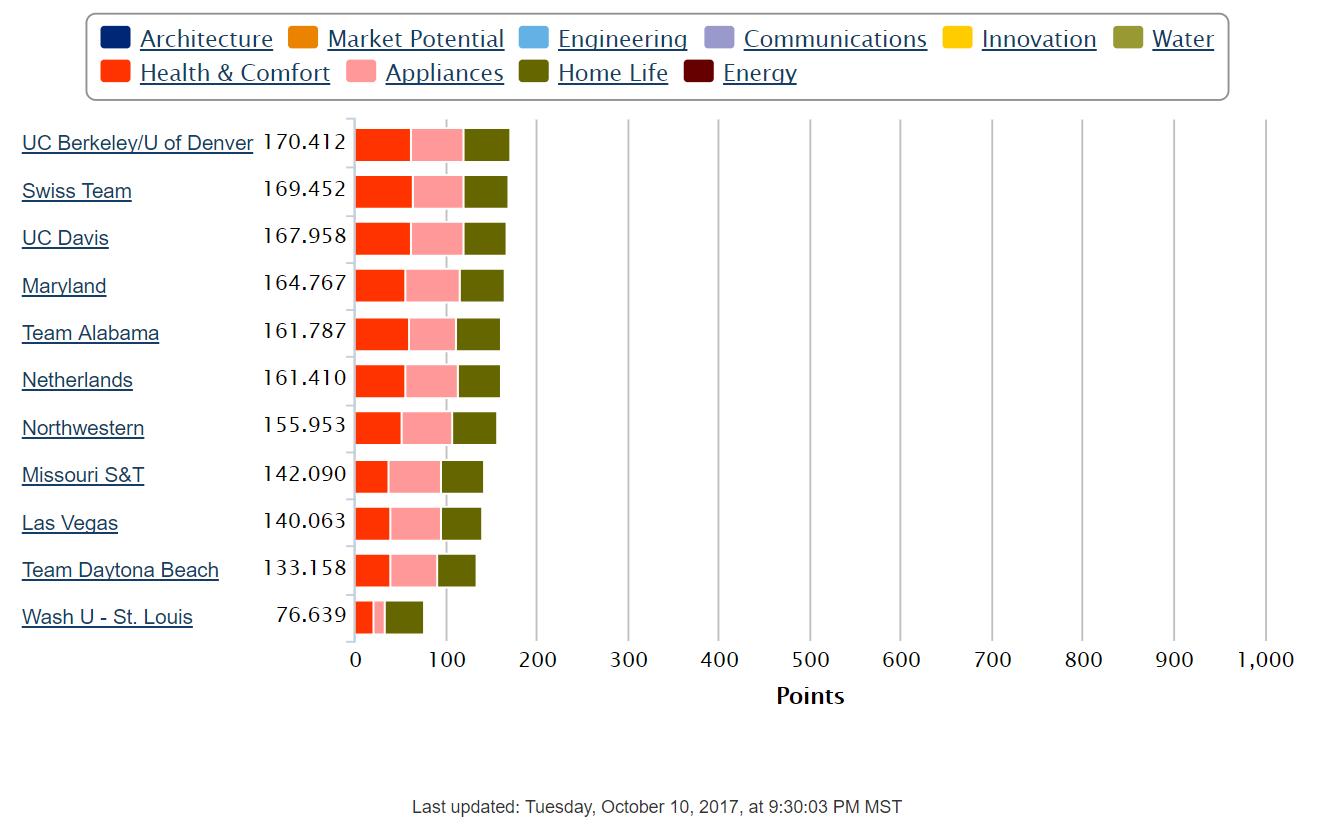 As of October 10, the 11 competing Solar Decathlon 2017 teams have earned points in the Health and Comfort, Appliances, and Home Life contests. (Credit: U.S. Department of Energy Solar Decathlon)
Ed explained that the Solar Decathlon collects a range of data points that factor into each team’s score. “We make electric power measurements with output from the utility electric meters at each house. We then have wireless sensors inside each house to measure temperature, relative humidity, carbon dioxide, and refrigerator and freezer temperatures.”
These “data-heads” use Campbell Scientific data loggers to capture measurements at 5 ̶60 second intervals in all 11 team houses. They then dive into Excel spreadsheets showing 15-minute averages so they can examine performance and ensure accuracy, all the while maintaining a stunning sense of humor.
 Norm Weaver (left) and Paul Norton of the Solar Decathlon instrumentation and monitoring team bike by a group of students on their human-powered ride. (Credit: Alexis Powers/U.S. Department of Energy Solar Decathlon)
Their net power graph, which shows the energy performance of each solar-powered house, is seriously full of fascinating facts. This data visualization reveals that most teams are producing more energy than they’re consuming, but a few teams are not.
Typically, Ed explained, it’s not that the solar energy systems aren’t working, but, rather, the teams that fall below zero have some sort of operational problem. Teams that have experienced construction or electrical permitting delays, for example, are most likely to face these challenges.

In one case, the team from Washington University in St. Louis, Missouri, did not start out following the general pattern of energy production in the solar village. Paul explained that their electrical system was not fully cleared by the local electrical inspector until Saturday, October 7. That’s why energy production for CRETE House remained flat at zero until October 8. This delay gave other teams a few days’ head start in certain scoring categories while the Wash U – St. Louis team reworked their electrical system. Not only were they unable to earn points in the Energy Contest, they also weren’t able to power up and energize all of the house’s appliances and regulatory functions that affect other measured contests.
The team from HU University of Applied Science Utrecht, Netherlands had a peculiar problem because theirs is a 50-Hertz (Hz) house (most U.S. houses are 60 Hz). They had trouble interacting with the U.S. grid. Competition officials solved the problem and Team Netherlands was properly compensated for the data loss with points. According to Ed, teams could move up or down in the standings when the appropriate scoring adjustments are made at the end of the competition.
On the bright side, the instrumentation team recently witnessed a Solar Decathlon milestone on October 9, 2017, when the first-ever snowfall in the competition’s 15-year history hit Denver. Despite the lack of sunshine, most of the team houses remained energy positive during the snowstorm. Ed reported that even when it was still cloudy, teams like the University of California, Davis saw net energy values start to go up again. These teams did a nice job of brushing the snow off the PV arrays to keep them performing well.
Also of note, the Swiss Team’s NeighborHub house performed well in the snowy conditions. Their exterior-facing photovoltaic (PV) panels can be raised and tilted for increased sun exposure, or lowered to a vertical orientation. In the vertical position, snow doesn’t accumulate on them. Such a benefit came with un-scorable bonus points as other teams climbed on their roofs to brush snow off their PV panels to ensure maximum energy production.
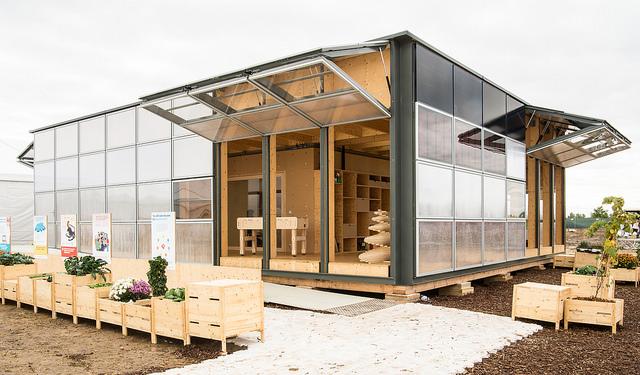 The NeighborHub house was designed to be used as a multipurpose, community-centric space. (Credit: Dennis Schroeder/U.S. Department of Energy Solar Decathlon)
As the snow demonstrated, each Solar Decathlon is a little bit different. Ed highlighted two new features of the competition this year. This marks the first time that measurements of carbon dioxide (CO2) levels have been used as a measure of indoor air quality. The team witnessed CO2 levels rise as team members stayed inside their houses and shut windows during the snow.
This is also the first year that overall energy production is value adjusted based on peak and off-peak utility energy use hours. These new features have been exciting to monitor, according to Ed and Paul. In fact, they’ve noticed how the new scoring features have inspired team strategies to maximize their point totals.
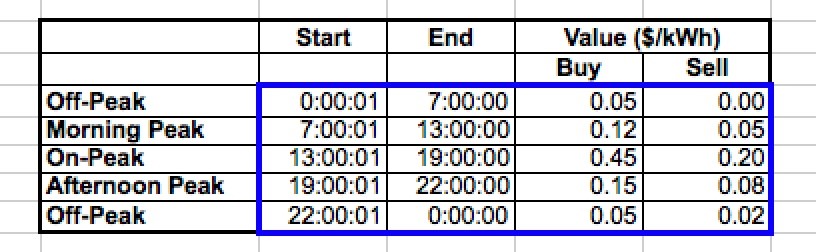 The Energy Contest of the U.S. Department of Energy Solar Decathlon 2017 evaluates each team’s energy production and a theoretical value to a utility of the energy they both contribute to and take from the Solar Decathlon electricity grid. (U.S. Department of Energy Solar Decathlon)
Take seven-time competitor Missouri University of Science and Technology. Ed paid a visit to their house on October 9, our famous snow day, because he noticed that it had gotten very cold inside the night before. The house had not heated back up by the time scoring resumed in the morning.
“It’s our responsibility to maintain the sensors that do the scoring for them,” Ed said. “So I went to ask if there was some problem with their heating system or if it was a problem with my sensor. They explained to me that they intentionally turned off their heating system to try to conserve energy.”
While it remains to be seen whether that was a good strategy, it is fascinating to see different teams taking different approaches to the competition. Maybe it’s worth losing a few points by not keeping the house’s overall temperature within the established range to earn more points with a positive energy balance on a cold day.
Of course, the Solar Decathlon is about more than just earning points. “These high-performing houses all demonstrate that you can be perfectly comfortable and still not use much energy with a well-designed system,” said Ed.
But when it comes time to announce the Solar Decathlon 2017 winner on October 14, those points—or fractions of a point—will matter a lot.
Tags: Contests, Energy Contest, Missouri S&T, Netherlands, Solar Decathlon 2017, Swiss Team, UC Davis, Wash U - St. Louis